Programs and Enrollment
Photo by Elisa Calvet B. on Unsplash

There are many ways in which people participate in Shambhala, however, we can’t easily measure all of them. The most significant ones we can gauge in the Shambhala Database (SDB) are program offerings and program enrollments.
- Offerings are an indication of the level of effort that members, educators, and leaders are making to offer programs for members, friends, and the public. Some offerings require people to register and others do not.
- Enrollments are an indication of the level of involvement in practice or study events that require an individual registration.
Changes over the last six years
We are a smaller community than we were in terms of programs or events offered as well as program enrollment.
While Shambhala continued to offer recurring activities and programs between 2017 and 2022, both scheduled events requiring registration and registrations declined by more than half between 2018 and 2022.
Enrollment by non-members and by more recent entrants to Shambhala (i.e. those entering between 2007 and 2018), and enrollments in introductory programs and offerings in the Way of Shambhala (Shambhala Training Levels I-V, In Everyday Life and Basic Goodness) course series, declined dramatically in this period.
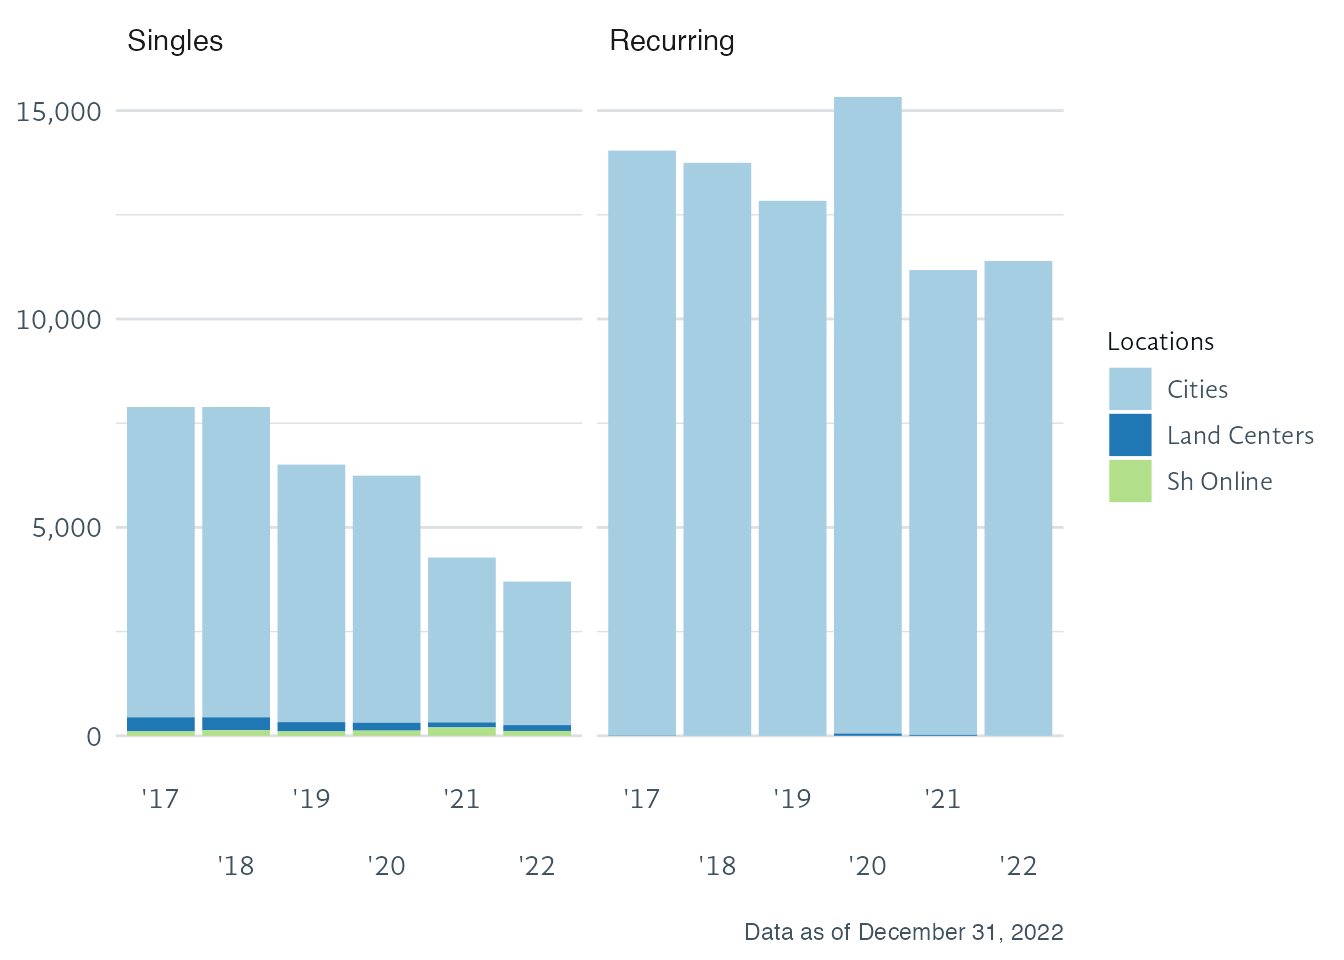
Program Offerings Profile
Shambhala center offerings can be classified into “single” and “recurring” events or programs.
- Programs that are classified as singles typically require separate registration, whether they occur just once or at multiple times, such as five Wednesdays. These include individually scheduled classes, community meetings, celebrations, etc., and they can occur in city centers, land centers such as Karmê Chöling, or on Shambhala Online.
- Recurring events repeat regularly. A daily or weekly meditation session is an example of the most frequent offering at an urban centre (as opposed to retreat centre).
Location of Shambhala Offerings
| Program Offerings by Year and Venue | |||||||
| Venue | '17 | '18 | '19 | '20 | '21 | '22 | |
|---|---|---|---|---|---|---|---|
| Singles | |||||||
| Cities | 7,445 | 7,446 | 6,179 | 5,928 | 3,955 | 3,444 | |
| Land Centers | 338 | 312 | 223 | 190 | 121 | 141 | |
| Sh Online | 106 | 132 | 105 | 124 | 201 | 116 | |
| Recurring | |||||||
| Cities | 14,033 | 13,748 | 12,835 | 15,273 | 11,152 | 11,391 | |
| Land Centers | 7 | 0 | 0 | 55 | 22 | 0 | |
| total | — | 21,929 | 21,638 | 19,342 | 21,570 | 15,451 | 15,092 |
| Data as of December 31, 2022 | |||||||
Program Enrollments Profile
Enrollments overall
Overall Enrollments have Decreased
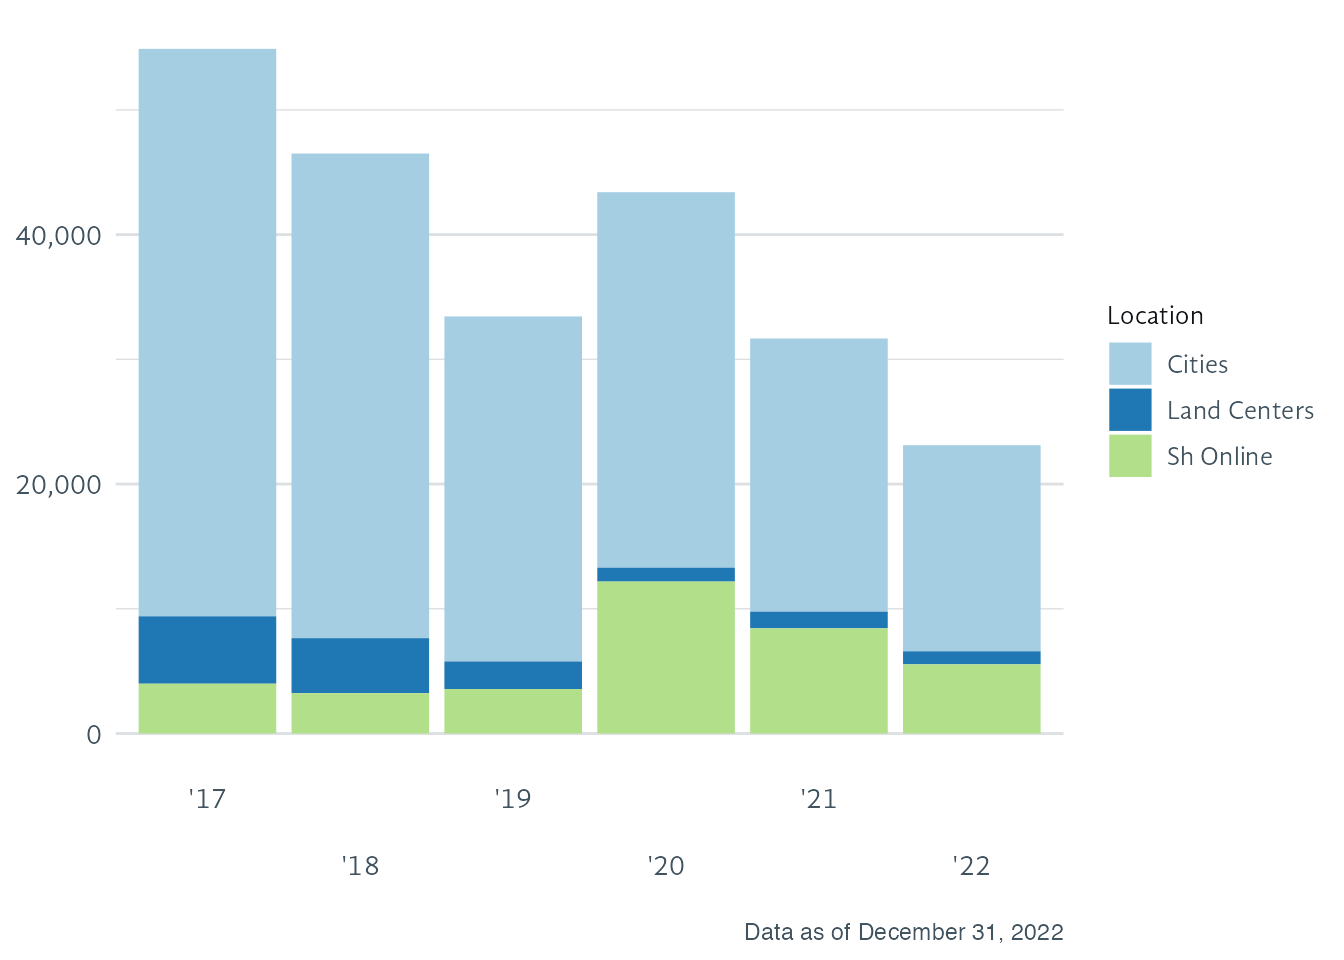
Annual program enrollment in Shambhala reached a high of almost 55,000 in 2017, but fell to a total of about 23,000 in 2022. Enrollment declines occurred in both city and land centers. Shambhala Online enrollments are now 85% higher than in 2017, but are half of what they were during the height of COVID-19 pandemic in 2020.
| Total Enrollments by Year and Type of Venue | |||||||
| Venue | '17 | '18 | '19 | '20 | '21 | '22 | |
|---|---|---|---|---|---|---|---|
| Cities | 45,497 | 38,857 | 27,662 | 30,104 | 21,901 | 16,524 | |
| Land Centers | 5,404 | 4,409 | 2,208 | 1,116 | 1,335 | 1,049 | |
| Sh Online | 3,993 | 3,235 | 3,569 | 12,182 | 8,436 | 5,543 | |
| total | — | 54,894 | 46,501 | 33,439 | 43,402 | 31,672 | 23,116 |
| Data as of December 31, 2022 | |||||||
Enrollment by membership status
Enrollment proportion by membership status
Shambhala now enrolls a greater proportion of members, relative to other categories (or it may be that people who enrolled in programs some years ago are now no longer Members). In this graph people are classified by their membership status at the end of 2022, not their status in previous years (e.g., when they actually enrolled in a program). Although we believe that Non-member and Friend of Shambhala categories did not change much over the six years, the other two categories probably did.
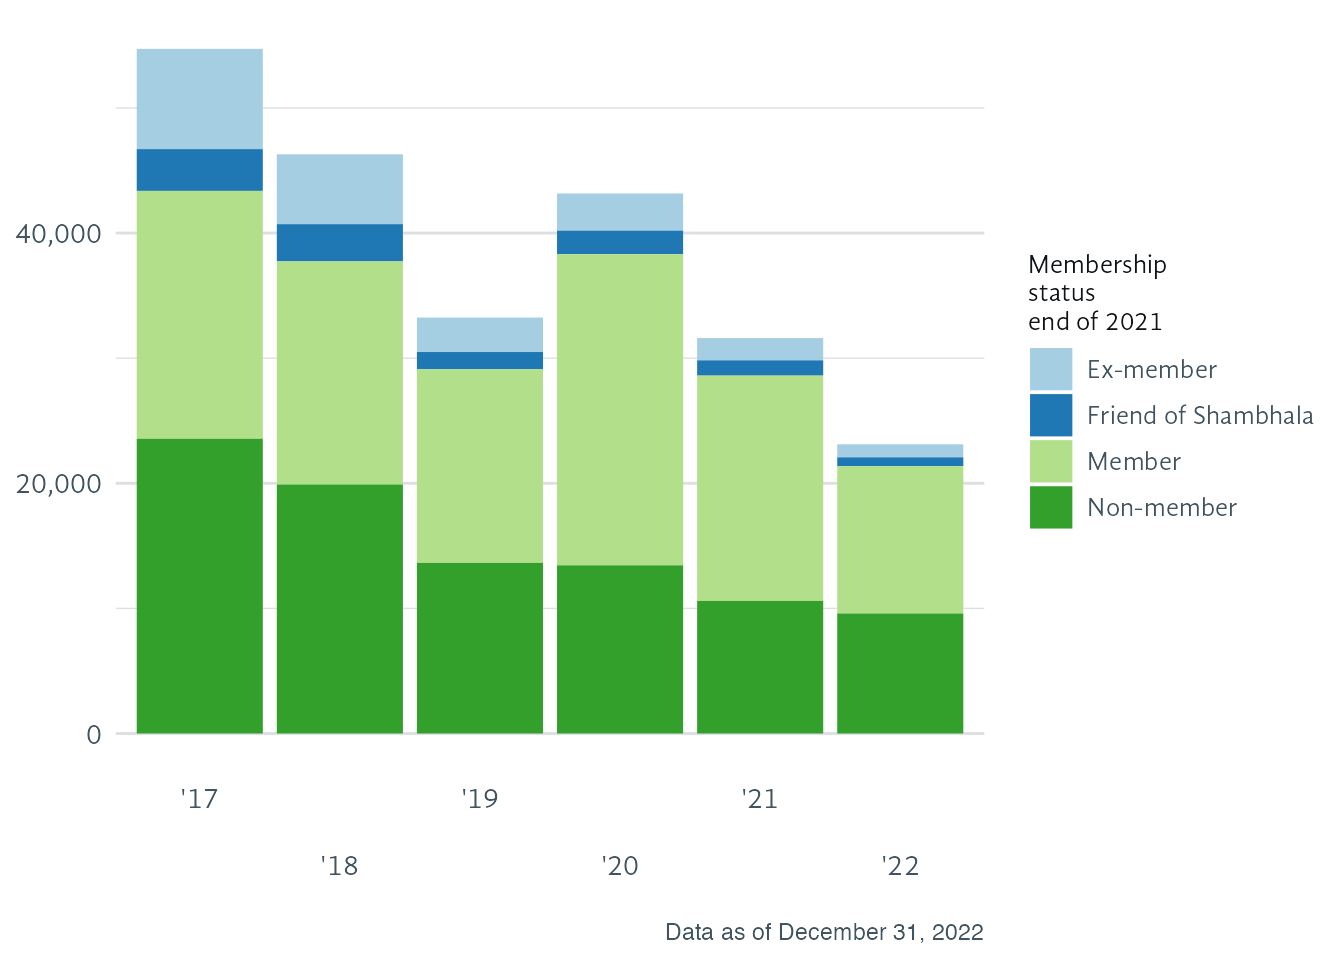
Program enrollment by Non-members and Ex-members of Shambhala declined from about one-half in 2017 to about one-third of all program registrations in 2022.
| Total Yearly Enrollments | |||||||
| By membership status at the end of 2021 | |||||||
| Status | '17 | '18 | '19 | '20 | '21 | '22 | |
|---|---|---|---|---|---|---|---|
| Ex-member | 8,014 | 5,583 | 2,755 | 2,967 | 1,778 | 1,041 | |
| Friend of Shambhala | 3,340 | 2,977 | 1,382 | 1,880 | 1,223 | 701 | |
| Member | 19,810 | 17,836 | 15,469 | 24,875 | 18,005 | 11,781 | |
| Non-member | 23,559 | 19,898 | 13,640 | 13,441 | 10,599 | 9,593 | |
| total | — | 54,723 | 46,294 | 33,246 | 43,163 | 31,605 | 23,116 |
| Data as of December 31, 2022 | |||||||
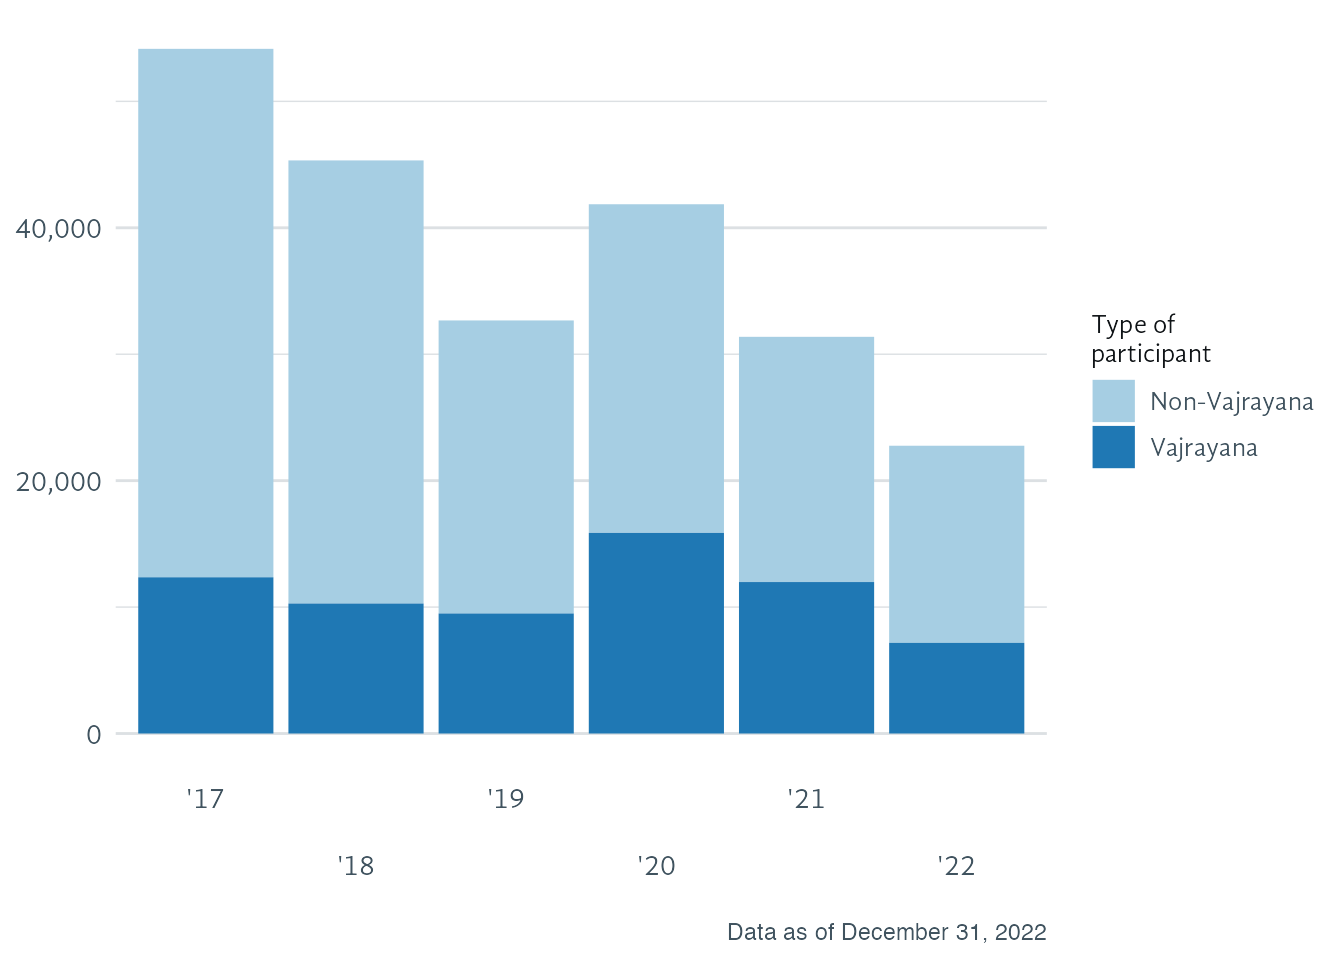
Enrollment by type of practitioner
Shambhala Societal Mirror data derived from the SDB uses a different criterion for designating a person as a Vajrayana practitioners than the self-report that is used in the Societal Mirror survey. Here we classify people depending on whether they have attended a program where Vajrayana practices were authorized or practiced. Most people who enroll in Shambhala programs are not Vajrayana practitioners.
Program enrollments by the participant’s type of practice
| Total Yearly Enrollments | |||||||
| By Current type of Practice | |||||||
| Status | '17 | '18 | '19 | '20 | '21 | '22 | |
|---|---|---|---|---|---|---|---|
| Non-Vajrayana | 41,798 | 35,048 | 23,179 | 25,995 | 19,397 | 15,590 | |
| Vajrayana | 12,356 | 10,281 | 9,493 | 15,867 | 11,980 | 7,172 | |
| total | — | 54,154 | 45,329 | 32,672 | 41,862 | 31,377 | 22,762 |
| Data as of December 31, 2022 | |||||||
Enrollment by date of first contact
In producing enrollment statistics from the SDB, we grouped members and friends of Shambhala into five cohorts based on the date of their estimated first contact with Shambhala. These time periods correspond to those self-reported in the survey.
Comparing enrollment patterns of different generations
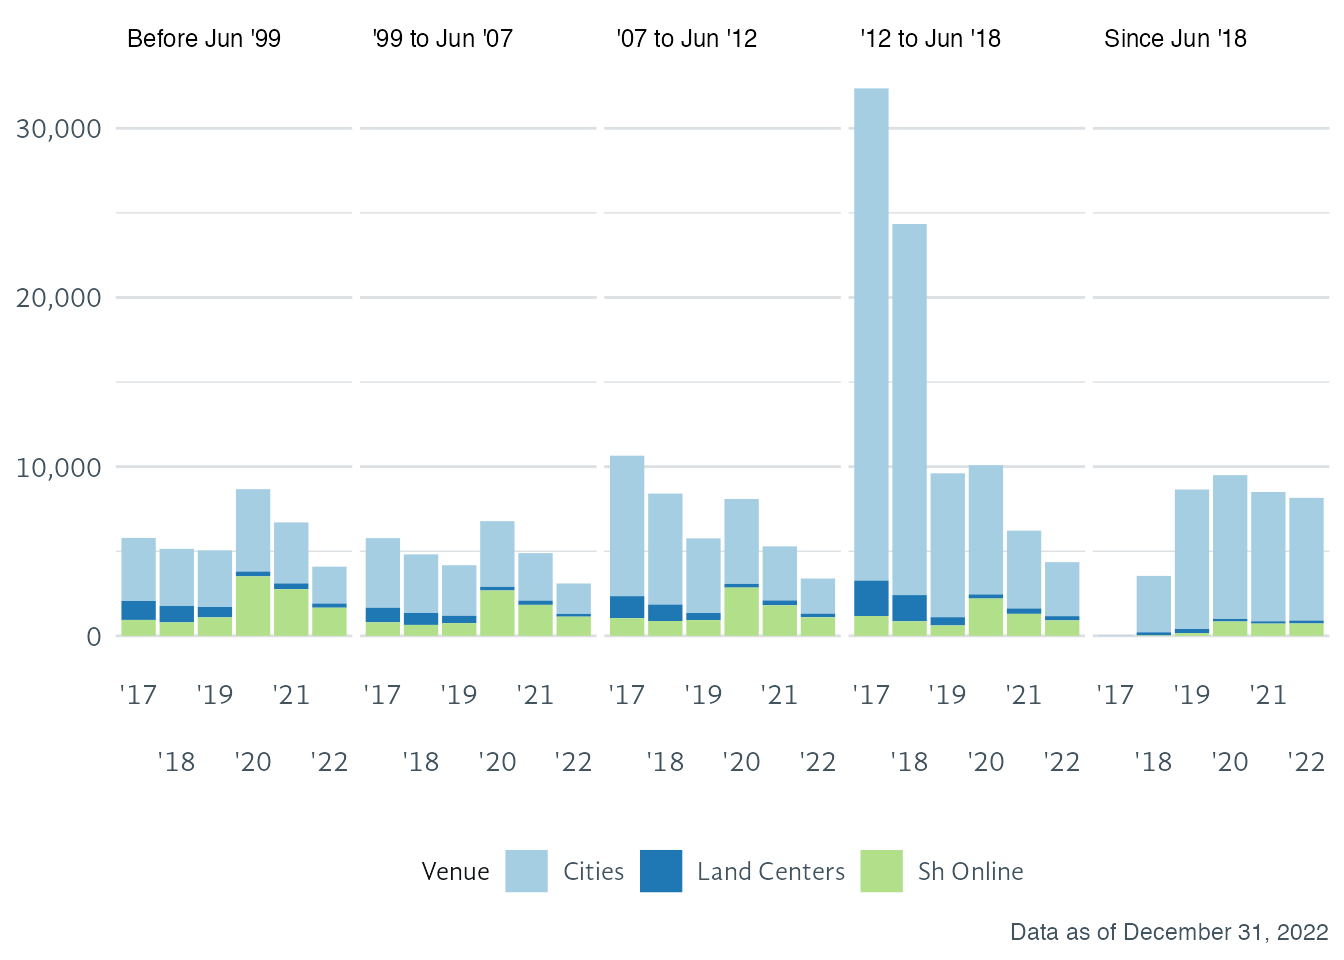
| Total Yearly Enrollments by Cohort and Venue | |||||||
| Venue | '17 | '18 | '19 | '20 | '21 | '22 | |
|---|---|---|---|---|---|---|---|
| Before Jun '99 | |||||||
| Cities | 3,725 | 3,375 | 3,346 | 4,870 | 3,608 | 2,179 | |
| Land Centers | 1,121 | 971 | 614 | 285 | 341 | 247 | |
| Sh Online | 941 | 796 | 1,092 | 3,515 | 2,757 | 1,663 | |
| '99 to Jun '07 | |||||||
| Cities | 4,113 | 3,461 | 2,988 | 3,885 | 2,811 | 1,799 | |
| Land Centers | 862 | 708 | 433 | 212 | 250 | 164 | |
| Sh Online | 800 | 646 | 753 | 2,683 | 1,831 | 1,133 | |
| '07 to Jun '12 | |||||||
| Cities | 8,305 | 6,559 | 4,414 | 5,017 | 3,196 | 2,078 | |
| Land Centers | 1,299 | 973 | 417 | 219 | 287 | 213 | |
| Sh Online | 1,047 | 877 | 932 | 2,852 | 1,806 | 1,098 | |
| '12 to Jun '18 | |||||||
| Cities | 29,094 | 21,934 | 8,507 | 7,641 | 4,600 | 3,194 | |
| Land Centers | 2,093 | 1,549 | 486 | 244 | 317 | 250 | |
| Sh Online | 1,173 | 860 | 615 | 2,205 | 1,300 | 913 | |
| Since Jun '18 | |||||||
| Cities | 39 | 3,332 | 8,243 | 8,499 | 7,642 | 7,252 | |
| Land Centers | 0 | 179 | 247 | 153 | 138 | 174 | |
| Sh Online | 1 | 31 | 159 | 848 | 722 | 731 | |
| total | — | 54,613 | 46,251 | 33,246 | 43,128 | 31,606 | 23,088 |
| Data as of December 31, 2022 | |||||||
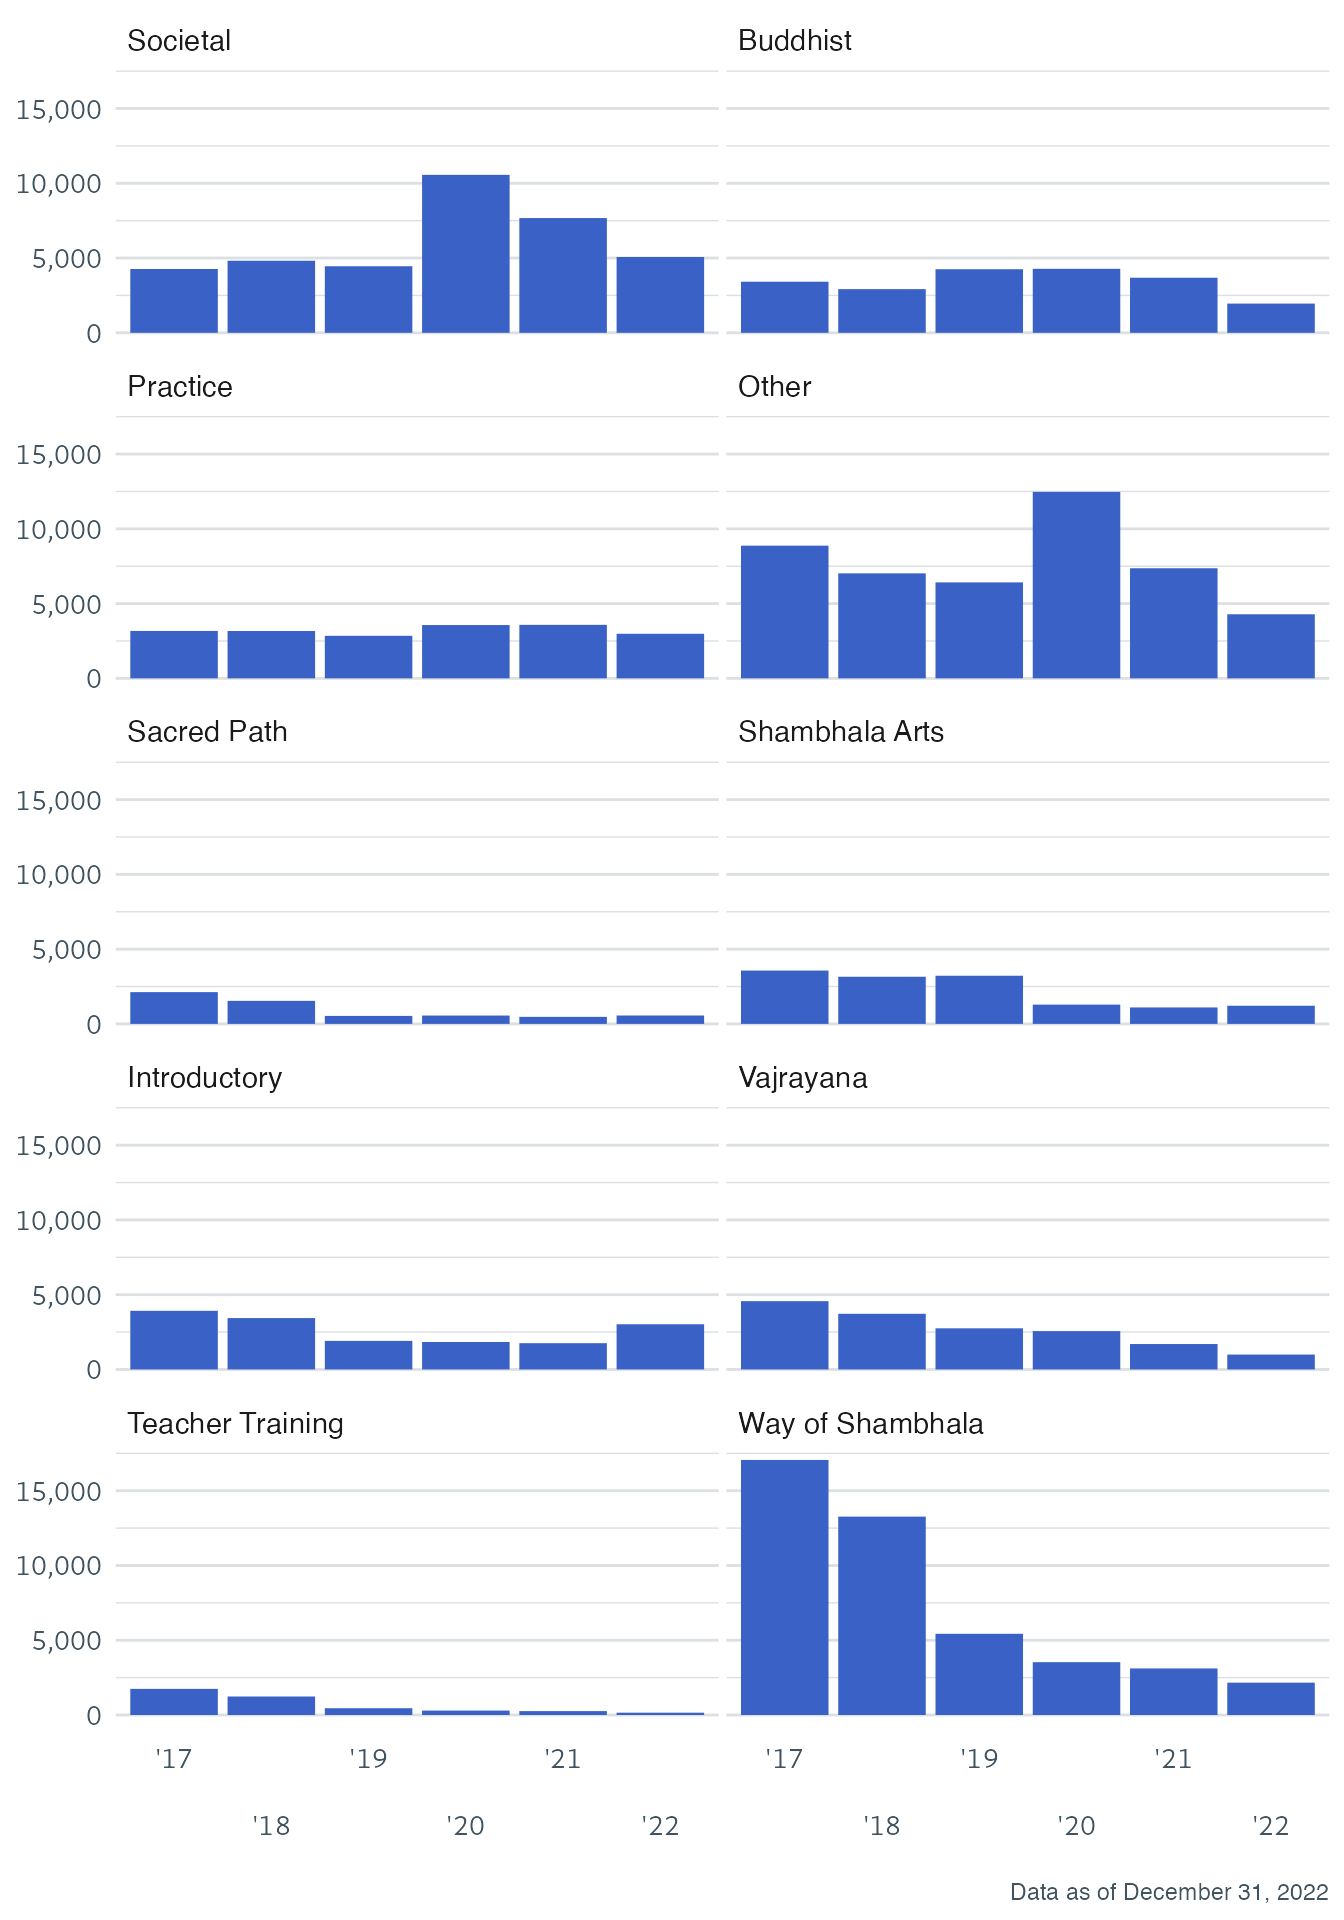
Enrollment by type of program
Programs listed in the SDB have been grouped into ten categories based on their content.
Enrollments change over time by type of program
Click on details to see more.
| Total Yearly Registrations by Type of Program | |||||||
| Program Type | '17 | '18 | '19 | '20 | '21 | '22 | |
|---|---|---|---|---|---|---|---|
| Buddhist | 3,417 | 2,920 | 4,251 | 4,279 | 3,683 | 1,954 | |
| Introductory | 3,923 | 3,436 | 1,910 | 1,836 | 1,756 | 3,022 | |
| Other | 8,874 | 7,022 | 6,417 | 12,472 | 7,363 | 4,285 | |
| Practice | 3,171 | 3,166 | 2,845 | 3,565 | 3,578 | 2,981 | |
| Sacred Path | 2,125 | 1,541 | 534 | 559 | 471 | 561 | |
| Shambhala Arts | 3,568 | 3,153 | 3,221 | 1,290 | 1,101 | 1,215 | |
| Societal | 4,267 | 4,820 | 4,452 | 10,564 | 7,675 | 5,070 | |
| Teacher Training | 1,748 | 1,237 | 453 | 297 | 260 | 154 | |
| Vajrayana | 4,567 | 3,723 | 2,751 | 2,566 | 1,700 | 996 | |
| Way of Shambhala | 17,058 | 13,268 | 5,431 | 3,533 | 3,114 | 2,163 | |
| total | — | 52,718 | 44,286 | 32,265 | 40,961 | 30,701 | 22,401 |
| Data as of December 31, 2022 | |||||||